Analysis of Vax Adverse Events
December 10, 2021

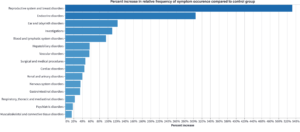
A READER has produced an informative and lucid dashboard that clarifies the adverse effects of the Covid injections. **
The statistical charts he has put together compare the relative frequency percentages of different adverse events found in the Vaccine Adverse Event Reporting System (VAERS) and data from its European counterpart, EudraVigilance, with control groups (either influenza vaccine data or past data).
The reader writes:
“Most of the adverse event dashboards that I know, such as Open VAERS, only give raw numbers and are kind of misleading and sensationalist. I wanted to try to see if there really is a higher percentage in relative frequency of adverse events being reported for Covid vaccines when compared to a control group, and if so, for which types of symptoms. Also, I allow the user to compare the symptoms at different levels of generality by using the MedDRA symptom classes and subclasses. If you use the symptom comparison tool, I would recommend comparing VAERS data to VAERS data and EudraVigilance to EudraVigilance and not mixing them. Also, I would suggest keeping the MedDRA symptom layer at 2 or below.
“I found, as probably would be expected, a much higher percentage (several thousand percent increase) of occurrence of cardiac conditions (especially myocarditis and pericarditis), similarly large increases in clotting, and thousands of percent increases in menstrual disorders.”
** Note, the site may take a few minutes to load up and it may not display on mobile phones. Make sure you view the drop down menu in the sidebar.
